Publications
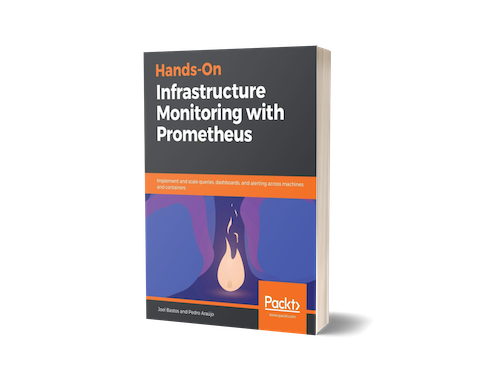
Hands-On Infrastructure Monitoring with Prometheus
A book on how to implement and scale queries, dashboards, and alerting across machines and containers
Yellow Box Podcast
Show about modern monitoring using Prometheus and the experience of publishing a book
Hands-On Infrastructure Monitoring with Prometheus
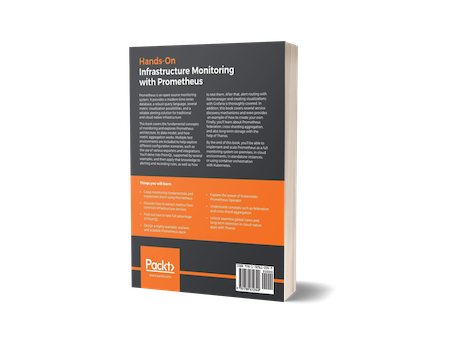
Book Description
Implement and scale queries, dashboards, and alerting across machines and containers
Prometheus is an open source monitoring system. It provides a modern time series database, a robust query language, several metric visualization possibilities and a reliable alerting solution for traditional and cloud-native infrastructure.
This book covers the fundamental concepts around monitoring and explores Prometheus architecture, its data model, and how metric aggregation works. Multiple test environments are included to help explore different configuration scenarios, like the use of various exporters and integrations. You’ll delve into PromQL, supported by several examples, and then apply that knowledge to alerting and recording rules, as well as how to test them. After that, alert routing with Alertmanager and creating visualizations with Grafana is thoroughly covered. In addition, this book covers several service discovery mechanisms and even provides an example of how to create your own. Finally, you’ll learn about Prometheus federation, cross-sharding aggregation and also long-term storage with the help of Thanos.
By the end of this book, you’ll be able to implement and scale Prometheus as a full monitoring system on-premises, in cloud environments, in standalone instances or using container orchestration with Kubernetes.
What You Will Learn
- Grasp monitoring fundamentals and implement them using Prometheus
- Discover how to extract metrics from common infrastructure services
- Find out how to take full advantage of PromQL
- Design a highly available, resilient, and scalable Prometheus stack
- Explore the power of Kubernetes Prometheus Operator
- Understand concepts such as federation and cross-shard aggregation
- Unlock seamless global views and long-term retention in cloud-native apps with Thanos
Chapters
- Monitoring Fundamentals
- An Overview of the Prometheus Ecosystem
- Setting Up a Test Environment
- Prometheus Metrics Fundamentals
- Running a Prometheus Server
- Exporters and Integrations
- Prometheus Query Language - PromQL
- Troubleshooting and Validation
- Defining Alerting and Recording Rules
- Discovering and Creating Grafana Dashboards
- Understanding and Extending Alertmanager
- Choosing the Right Service Discovery
- Scaling and Federating Prometheus
- Integrating Long-Term Storage with Prometheus
Yellow Box Podcast
I was invited to participate in the Mindera Yellow Box show and share what drove me to write a book on modern monitoring using Prometheus while discussing the technology background, ecosystem and how it behaves at scale.
Programar Magazine
This magazine has been around for more than a decade, and its core purpose is to improve Portuguese citizens technology awareness, skills and ensure knowledge dissemination. The magazine tackles subjects like programming languages, operating systems, security, networking, testing and automation while being completely free.
Introduction to password auditing
I was invited, in the scope of a Portuguese infosec community, to write an article regarding password strength auditing, while expanding on concepts like hashing, salting and available attack vectors.
The article covers CPU vs GPU based cracking approaches to obtain collisions of widely known hashing algorithms like MD5, SHA-1, SHA-256, SHA-512 and even salted MD5.
The results are thoroughly explained and presented on a side-by-side structure, ensuring a comprehensive comparison of every strategy taken. The article (available on page 57) is written in Portuguese, but the data speaks for itself.


